empty
 
 
26.12.2022 07:46 AM
Breaking forecast for EUR/USD on December 26, 2022

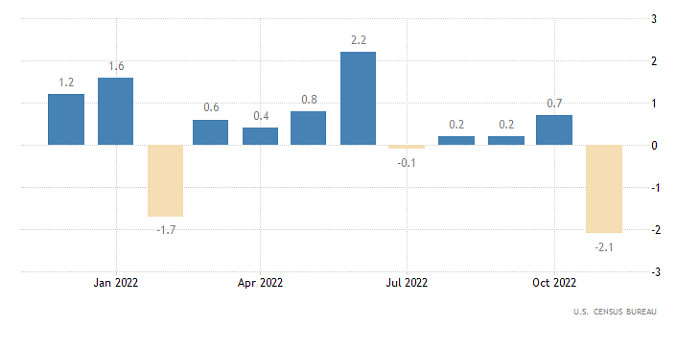
On Friday, the US published mixed data. Thus, the euro was quite stable. On the one hand, durable goods orders dropped by 2.1%, whereas economists had expected a decline of just 0.5%. Meanwhile, new home sales, which should have decreased by 5.0%, increased by 5.8%. The reports were published at a different time and each of them should have influenced the market. Thus, the US dollar was expected to decline and then recoup all the losses. However, the situation was the opposite. The market simply ignored the macroeconomic data. There is no wonder since all the previous week, the market was ignoring all the reports and the euro was trading in a narrow range. What is more, Friday was the last working day before Christmas and it seemed that investors left for the holidays long ago. Today, the US and Europe continue to celebrate the holiday. That is why the market is likely to remain stuck until the next year.

US Durable Goods Orders

This image is no longer relevant

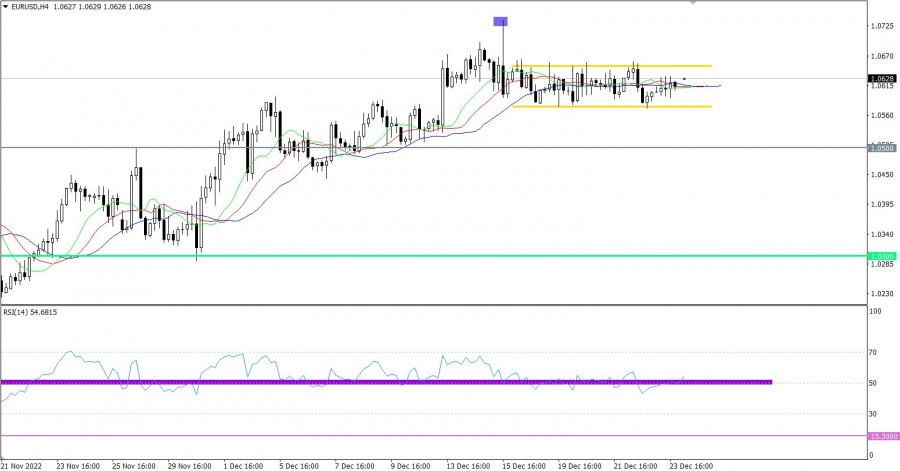
The euro/dollar pair has been trading within the sideways channel of 1.0580/1.0660 for the second week in a row. This movement points to uncertainty among traders and an accumulation process. Traders should also take into account that trading activity usually falls in the last working days of the year.

On the four-hour chart, the RSI technical indicator is hovering along the mid line 50, which corresponds to a flat movement. On the daily chart, the indicator is moving in the upper area of 50/70, which points to the bullish sentiment.

On the four-hour chart, the Alligator's MAs have numerous intersections, which corresponds to the flat movement. On the daily chart, the indicator is ignoring local price changes. The MAs are headed upwards.

This image is no longer relevant

Outlook

The long-lasting sideways movement may lead to new price changes. Under the current conditions, traders should wait for the price settlement beyond either limit. In this case, they will get a technical signal of a breakout, which will point to further price movement.

In terms of the complex indicator analysis, we see that in the short-term and intraday periods, the indicator is providing a mixed signal because of stagnation. In the mid-term period, the indicators are ignoring local price changes, still providing a buy signal.

Dean Leo,
ইন্সটাফরেক্সের বিশ্লেষণ বিশেষজ্ঞ
© 2007-2024
ইনস্টাফরেক্স দিয়ে ক্রিপ্টোমুদ্রা দর পরিবর্তনে আয় করুন।
মেটাট্রেডার 4 ডাউনলোড করে আপনার প্রথম ট্রেড চালু করুন।
  • Grand Choice
    Contest by
    InstaForex
    InstaForex always strives to help you
    fulfill your biggest dreams.
    প্রতিযোগীতায় অংশগ্রহণ করুন
  • চ্যান্সি ডিপোজিট
    আপনার অ্যাকাউন্টে $3,000 জমা করুন এবং $5000 এর অধিক নিন!
    চ্যান্সি ডিপোজিট প্রচারাভিযানে আমরা নভেম্বর $5000 লটারি করেছি! একটি ট্রেডিং অ্যাকাউন্টে $3,000 জমা করে এই অর্থ জেতার একটি সুযোগ নিন! এই শর্ত পূরণ করে, আপনি একজন অংশগ্রহণকারী হতে পারবেন।
    প্রতিযোগীতায় অংশগ্রহণ করুন
  • বুদ্ধিমত্তার সাথে ট্রেড করুন, ডিভাইস জিতুন
    আপনার অ্যাকাউন্টে কমপক্ষে $৫০০ টপ আপ করুন, প্রতিযোগিতার জন্য সাইন আপ করুন এবং মোবাইল ডিভাইস জেতার সুযোগ পান।
    প্রতিযোগীতায় অংশগ্রহণ করুন
  • ১০০% বোনাস
    আপনার ডিপোজিটের উপর ১০০% বোনাস পাওয়ার অনন্য সুযোগ
    বোনাস পান
  • ৫৫% বোনাস
    আপনার অ্যাকাউন্টে প্রতিটি ডিপোজিটের উপর ৫৫% বোনাসের জন্য আবেদন করুন
    বোনাস পান
  • ৩০% বোনাস
    প্রতিবার আপনার অ্যাকাউন্ট টপ আপ করার সময় ৩০% বোনাস নিন
    বোনাস পান

সুপারিশকৃত নিবন্ধ

এখন কথা বলতে পারবেন না?
আপনার প্রশ্ন জিজ্ঞাসা করুন চ্যাট.
Widget callback