This entry was posted on Wednesday, June 23rd, 2010 at 4:35 pm and is filed under Trading. You can follow any responses to this entry through the RSS 2.0 feed. You can leave a response, or trackback from your own site.
23.06.2010 Post in Trading
Besides reversal patterns on the charts of technical analysis of Forex market the figures of the trend continuation can be singled out. The trend figures illustrate a short period of the market correction. The most important figures of the market continuation are flags, pennants, triangles, wedges and rectangles. Below we will discuss every figure in detail.
Flags and Pennant
Flags and pennants are the most often models of the trend continuation, as a rule, they can be noticed in a very energetically developing trend. The dynamics of the flag and of the pennant have much in common. Both of these figures arise after a dynamic market movement, forming almost a straight line on the graph.
The figure actually is a pause in the trend development, during which the price is almost at one and the same level. A pennant looks as a small triangle on the chart whereas a flag is a short-term price range. After the figure has broken the curve, the prior trend continues, passing the distance equal to that of the figure.
Flag and pennant are the reliable trend continuation figures, when they are moving against the trend. Thus, a flag which is inclined downside gives a bullish signal. If the flag is inclined upwards, the signal is bearish. Before the emergence of the figure, the market activity is high. After the trend continuation pattern has arisen, the activity starts to fall. When the break happened, the activity is upturning again. Another feature of a flag is that when the market is lowering, the figures are being formed much faster, than during the ascending market. The appearance of these patterns on the actively expanding market denotes that a puncture is possible.
It should also be mentioned that flags and pennants are directed not against but along the prior trend and are more a trend retrace.
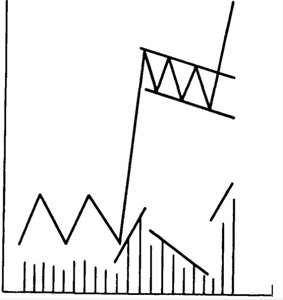
Flag
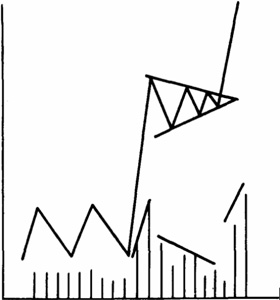
Pennant
Unlike rebound figures, the figures of the trend continuation can very often denote the false direction of the trend. The things are more complicated with the figure of the trend reversal “triangle”.
Triangle
Triangles can be viewed as flags without flagpoles. Four types of triangles are distinguished: symmetrical, uprising, downfalling and expanding.
A symmetrical triangle is built by symmetrically converging support and resistance lines, drawn though at least four points. The symmetrical convergence of these lines reflects the existing on the currency market balance between demand and supply. Consequently, the breakthrough can emerge in any direction. But if there is a bullish symmetrical triangle, the break is likely to be directed like the previous trend, proving the name of triangle as a figure of trend continuation.
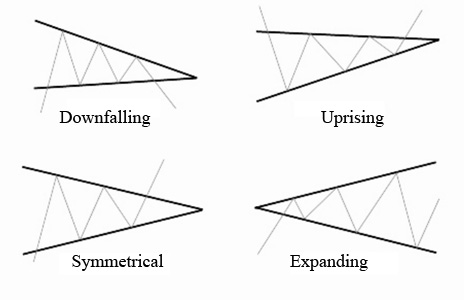
Uprising Triangle
An uprising triangle is formed by the horizontal resistance line and the uprising support line. This figure demonstrates the situation when the demand exceeds the supply considerably. The break is upward, and further on the target is the price level which is positioned at a distance equal to the base of the triangle from the point of the break through.
Downfalling triangle
A downfalling triangle is a mirror reflection of the uprising one. It is formed by a horizontal support line and a declining resistance line. The figure illustrates the situation on the market when the supply is much higher than demand. The price breakthrough happens in this situation to the bottom. The trading volume is gradually declining in accordance to approaching the high, but it surges at the moment of the break.
Expanding Triangle
An expanding triangle, or megaphone, is an inverted image of any prior discussed triangles, where not the base of the triangle, but its corner is adjusted to the line of the prior trend. The change of the trading volume happens accordingly, the volume increases proportionally to the formation of the expanding triangle.
The break can be considered concluded if the close price was fixed outside the corresponding line, that is either above or below one of the triangle sides. After the break the curve is usually rebounding towards the punctured side.
Wedges
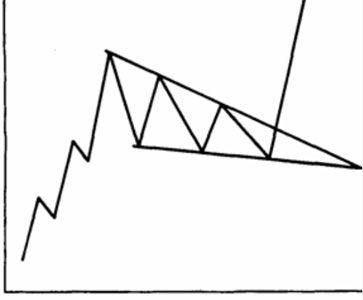
Wedge is closely related to the patterns of triangle and pennant. It is similar in form and the time of formation, but from the viewpoint of form and analysis, it resembles a pennant without a flagpole more. It’s usually broken through in the direction opposite to its incline, but coinciding with the direction of the prior trend. Depending on the trend, the wedge can be bullish or bearish. By the wedge on the chart it is possible to see only the trend continuation.
Rectangles
The figure Rectangle demonstrates the market consolidation period. After its breakthrough, the currency is likely to continue the previous trend. But its disruption can, however, lead to the transition from the trend continuation to the recoil.
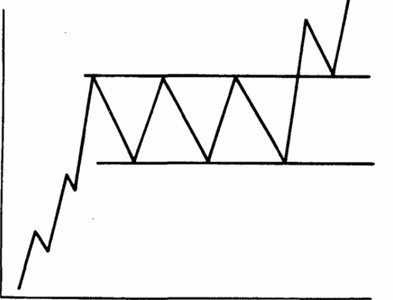
This figure is easily distinguished, and it can be considered as a small sideways trend. When it is formed along the up-trend and the price breaks though it upwards, the rectangle is called bullish.
Added by Andrey Misyuk,
InstaForex Clients’ relationship manager
Tags:


Pingback: LUTHER