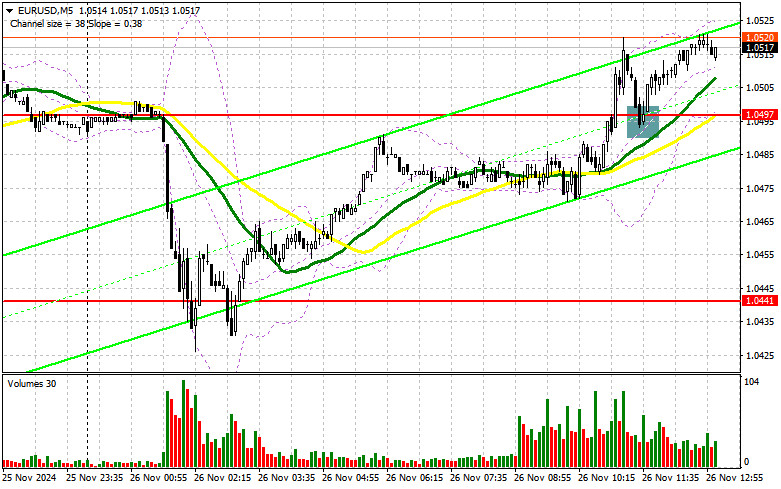
In my morning forecast, I focused on the 1.0497 level and planned to make trading decisions from that point. Let's examine the 5-minute chart to analyze what happened. A breakout and subsequent retest of 1.0497, in the absence of Eurozone economic data, provided an excellent entry point for buying the euro. At the time of writing, this resulted in a 20-point increase in the pair. The technical outlook for the second half of the day remains unchanged.
For Opening Long Positions on EUR/USD:
The absence of Eurozone statistics has allowed the euro to make slight gains, but attention now shifts to US data. Strong consumer confidence and new home sales figures from the US are likely to support the dollar, increasing pressure on EUR/USD. Particular focus will also be on the minutes from the Federal Reserve's November meeting, which could provide insights into possible rate cuts in December.
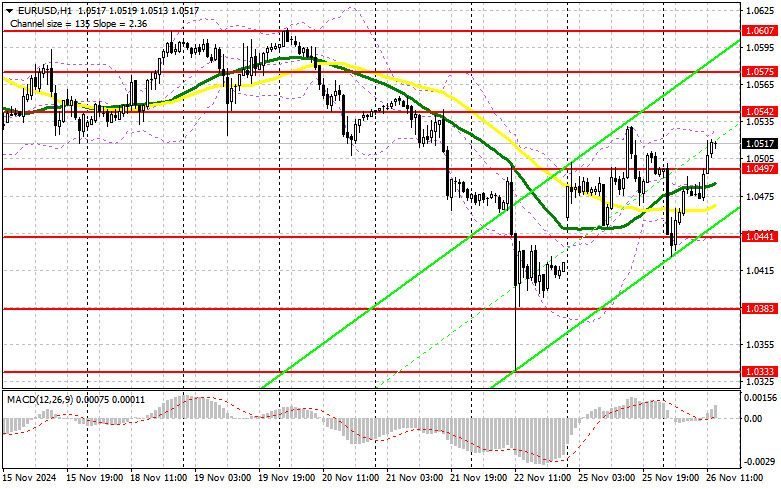
If the pair comes under pressure after the data, I will monitor the 1.0497 support level, which acted as resistance earlier in the day. A failed breakout at this level would provide an ideal opportunity to build long positions, targeting a correction toward 1.0542. A breakout and retest of this range would confirm the validity of a buying opportunity, with targets at 1.0575 and the 1.0607 high, where I will take profits.
If EUR/USD declines and there is no activity around 1.0497 in the second half of the day, the euro will likely face renewed pressure. In this case, I will wait for a failed breakout near the 1.0441 support level before entering long positions. Alternatively, I will consider buying on a rebound from 1.0383, aiming for an intraday correction of 30–35 points.
For Opening Short Positions on EUR/USD
If the pair rises, defending the 1.0542 resistance level will be a key task for sellers in the second half of the day. A failed breakout at this level, combined with strong US data, would signal an opportunity to open short positions targeting the 1.0497 support level. A breakout and consolidation below this range, followed by a retest from below, would confirm selling opportunities, with the pair heading toward 1.0441. The final target would be the 1.0383 level, where I plan to take profits.
If EUR/USD climbs further in the second half of the day and bears remain inactive around 1.0542, I will delay selling until the pair tests the next resistance at 1.0575. I also plan to sell there but only if the pair fails to consolidate at this level. Alternatively, I will open short positions on a rebound from 1.0607, aiming for a downward correction of 30–35 points.
Commitment of Traders (COT) Report
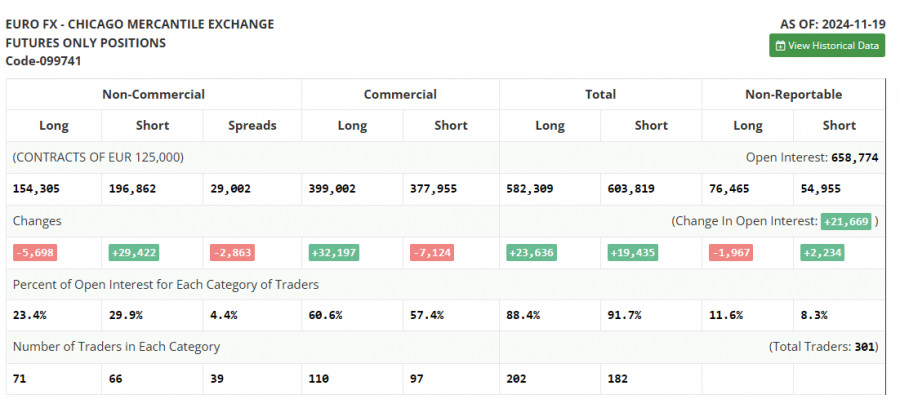
The November 19 COT report revealed a significant increase in short positions and a reduction in long positions. Amid Donald Trump's presidency, ongoing news about protective tariffs targeting China, Canada, and Mexico, and the European Central Bank's continued need to lower rates, the euro remains under pressure against the US dollar.
The report highlighted that there is still strong interest in selling the euro, even at current lows. The lack of buyers is also notable, making a near-term rise in the pair unlikely. According to the COT report, long non-commercial positions fell by 5,698 to 154,305, while short non-commercial positions increased by 29,422 to 196,862. Consequently, the gap between long and short positions narrowed by 2,422.
Indicator Signals
Moving Averages:The pair is trading slightly above the 30 and 50-day moving averages, keeping the prospects for a correction alive.
Bollinger Bands:If the pair declines, the lower boundary of the Bollinger Bands near 1.0441 will act as a support level.
Indicator Descriptions
- Moving Average (MA): Identifies the current trend by smoothing volatility and noise.
- Period – 50: Marked in yellow on the chart.
- Period – 30: Marked in green on the chart.
- MACD (Moving Average Convergence/Divergence):
- Fast EMA – Period 12.
- Slow EMA – Period 26.
- Signal Line SMA – Period 9.
- Bollinger Bands: Indicates price volatility and potential breakout levels.
- Non-Commercial Traders: Speculative participants, such as individual traders, hedge funds, and large institutions using the futures market for speculation.
- Long Non-Commercial Positions: Total open long positions held by speculative traders.
- Short Non-Commercial Positions: Total open short positions held by speculative traders.
- Net Non-Commercial Position: The difference between speculative traders' short and long positions.


