EUR/USD 5-Minute Analysis
On Thursday, the EUR/USD currency pair exhibited highly unusual movements. The sequence of events began on Wednesday evening when Jerome Powell announced the results of the Fed meeting. While the key interest rate remained unchanged, Powell addressed several critical questions regarding the current state of the economy, labor market, unemployment, and inflation. We believe that the market could have reacted to Powell's statements, yet for some reason, it did not.
Yesterday, the movements and reactions in the market were particularly noteworthy. The key GDP reports released that day for Germany, the European Union, and the United States displayed a consistent trend. While it's true that all three reports fell short of forecasts, the individual results paint different pictures: the American economy grew by 2.3%, the German economy contracted by 0.2%, and the European economy showed no growth at all. This raises the question: which economy is in a better state?
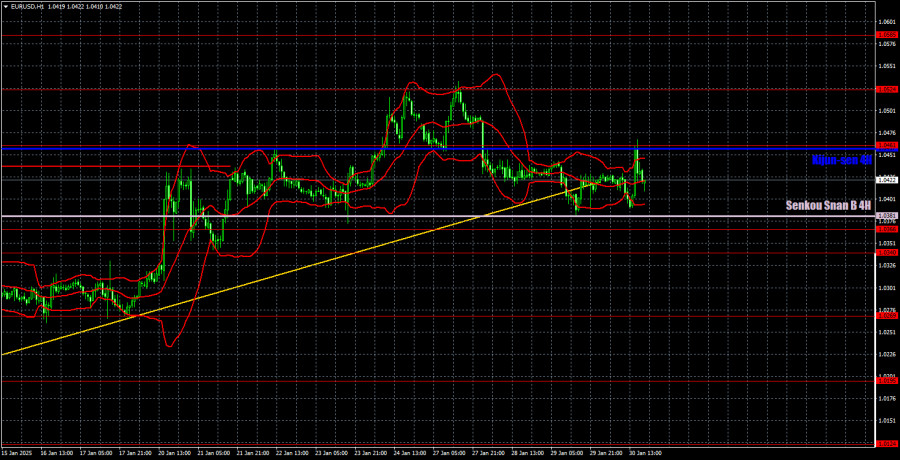
Following this, the results of the European Central Bank meeting were announced. It was a distinctly dovish meeting, as rates were lowered once again—a move the market had anticipated. Christine Lagarde also confirmed that the easing of monetary policy would continue at the planned pace. In response, the euro initially showed some growth but ended up returning to its original position by evening. The technical indicators suggest the end of the upward trend; however, volatility has been declining over the past few days, with prices trading between the lines of the Ichimoku indicator.
On that day, only one trading signal was generated, yet it was a strong one. At the start of the American trading session, the price rebounded from the 1.0453-1.0461 range before beginning to drop. By evening, the euro had lost approximately 30 pips, providing traders with a clear opportunity to profit from this straightforward signal.
COT Report
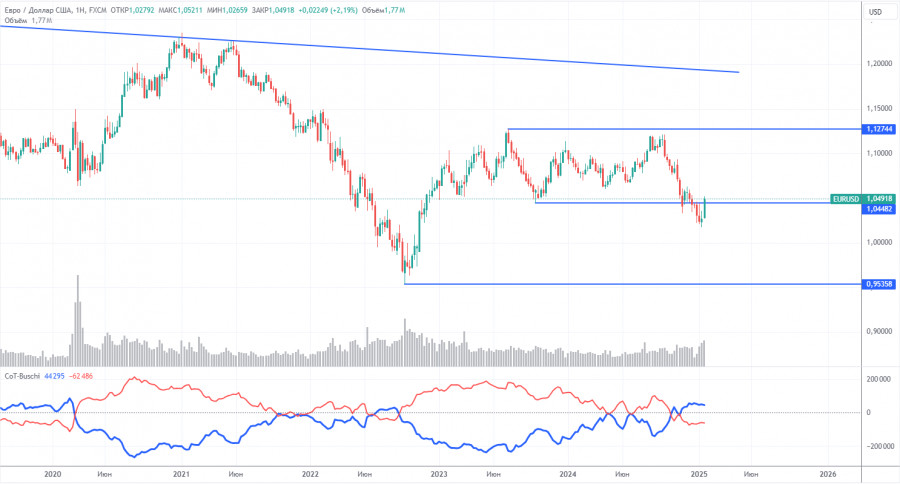
The latest Commitments of Traders (COT) report, dated January 21, shows that the net position of non-commercial traders has remained bullish for quite some time. However, bears have now taken the lead. Two months ago, there was a significant increase in the number of short positions held by professional traders, causing the net position to turn negative for the first time in a long while. This indicates that the European currency is now being sold more frequently than it is being bought.
We do not see any fundamental factors that would strengthen the European currency. The recent growth of the euro on the weekly timeframe appears to be a simple retracement. While the pair may experience a correction for a few more weeks, the long-term downward trend that has persisted for 16 years is unlikely to be reversed.
At this time, the red and blue lines have crossed, indicating a bearish trend in the market. During the last reporting week, the number of long positions in the "Non-commercial" category increased by 4,900, while the number of short positions rose by 6,900. As a result, the net position decreased by another 2,000 contracts.
EUR/USD 1-Hour Analysis
On the hourly timeframe, the currency pair is maintaining an upward trend, but it has broken the trend line. We believe that a decline will resume in the medium term regardless. The Federal Reserve may only cut rates 1-2 times in 2025, which indicates a more hawkish sentiment than what the market had anticipated. This factor, among others, is expected to support the U.S. dollar in the future. The price has broken the trend line, and it now needs to break below the Senkou Span B line to confirm a new downward trend on the hourly timeframe.
On January 31, we highlight the following trading levels: 1.0124, 1.0195, 1.0269, 1.0340-1.0366, 1.0461, 1.0524, 1.0585, 1.0658-1.0669, 1.0757, 1.0797, and 1.0843, as well as the Senkou Span B (1.0381) and Kijun-sen (1.0458) lines. Please note that the Ichimoku indicator lines may change throughout the day, which should be considered when determining trading signals. Remember to set a Stop Loss order at breakeven if the price moves 15 pips in your favor. This will help protect against potential losses if the signal turns out to be false.
A series of reports from Germany is scheduled for Friday in the European Union, focusing on retail sales, unemployment, and inflation. In the United States, the personal consumption expenditure price index will be released. Given the significance of these reports, it is difficult to categorize them as secondary. However, the last two trading days have shown that the market is not very responsive to logical movements or trading in general. Therefore, it is possible that Friday may not deliver strong movements or clear signals.
Illustration Explanations:
- Support and Resistance Levels (thick red lines): Thick red lines indicate where movement may come to an end. Please note that these lines are not sources of trading signals.
- Kijun-sen and Senkou Span B Lines: Ichimoku indicator lines transferred from the 4-hour timeframe to the hourly timeframe. These are strong lines.
- Extreme Levels (thin red lines): Thin red lines where the price has previously bounced. These serve as sources of trading signals.
- Yellow Lines: Trendlines, trend channels, or any other technical patterns.
- Indicator 1 on COT Charts: Represents the net position size for each category of traders.


