empty
 
 
01.07.2024 09:34 AM
EUR/USD and GBP/USD: Technical analysis on July 1

EUR/USD

This image is no longer relevant

Higher timeframes

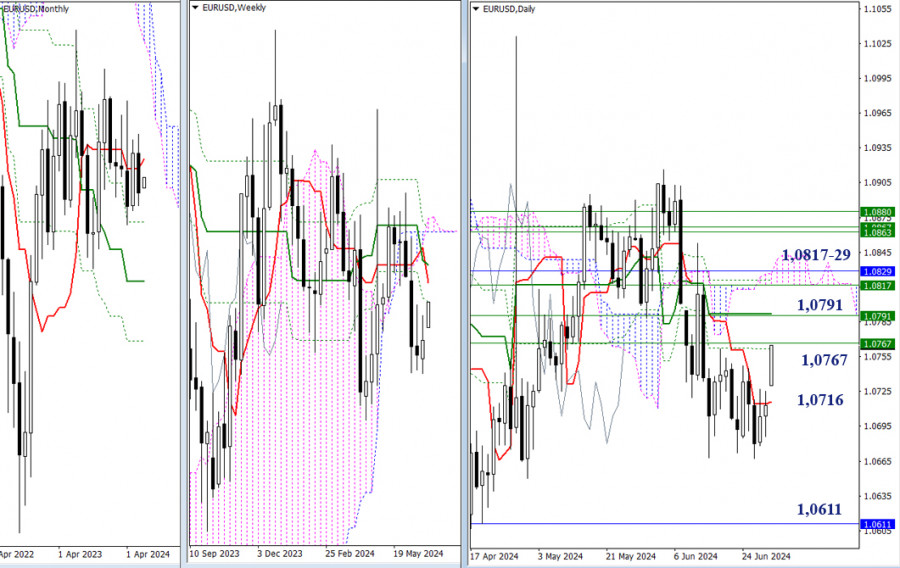
Earlier, the market remained in a state of uncertainty. With the start of a new week and month, a significant bullish gap has formed, followed by a sustained rise from EUR/USD. Currently, the pair has reached the resistances of the daily (1.0762) and weekly (1.0767) Fibonacci Kijun levels. If the pair continues to rise and the pair breaks through these resistances, the next target will be the 1.0791 mark, which currently combines the daily mid-term trend and the weekly short-term trend. After this, the bulls will be drawn to the cluster of levels around 1.0817-29 (weekly mid-term trend + monthly short-term trend + daily cloud). Under current conditions, the bears must break through the support of the daily short-term trend (1.0718) and test the low (1.0667).

This image is no longer relevant

H4 – H1

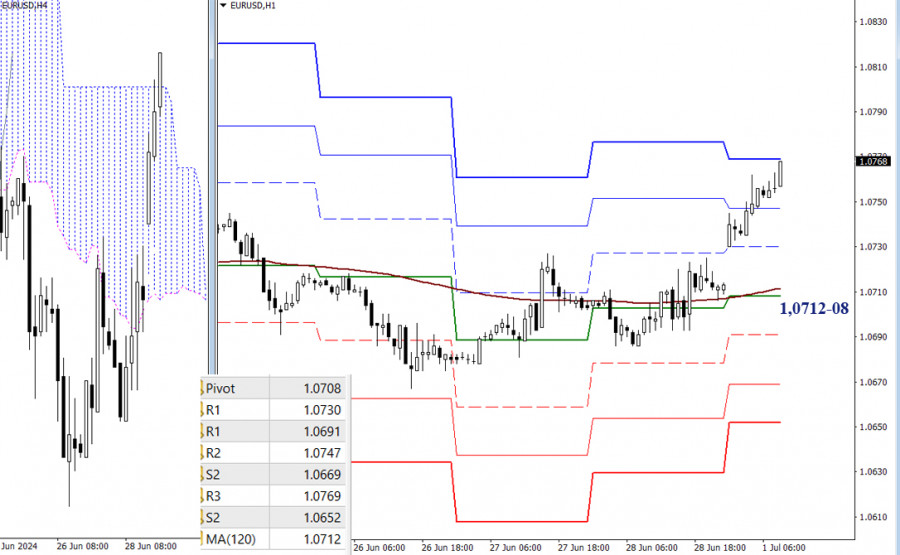
The bulls currently have the main advantage on the lower time frames, as they demonstrate a successful rise. Thanks to this, buyers are now testing the final resistance of the classic Pivot levels (1.0769). If the pair continues to rise, the focus will shift to targets on the higher time frames. Targets on the lower time frame will become relevant again if the pair declines and the bears re-enter the market. The classic Pivot levels may act as support levels, and the current balance of power may change with a breakthrough of the weekly long-term trend (1.0712).

***

GBP/USD

This image is no longer relevant

Higher timeframes

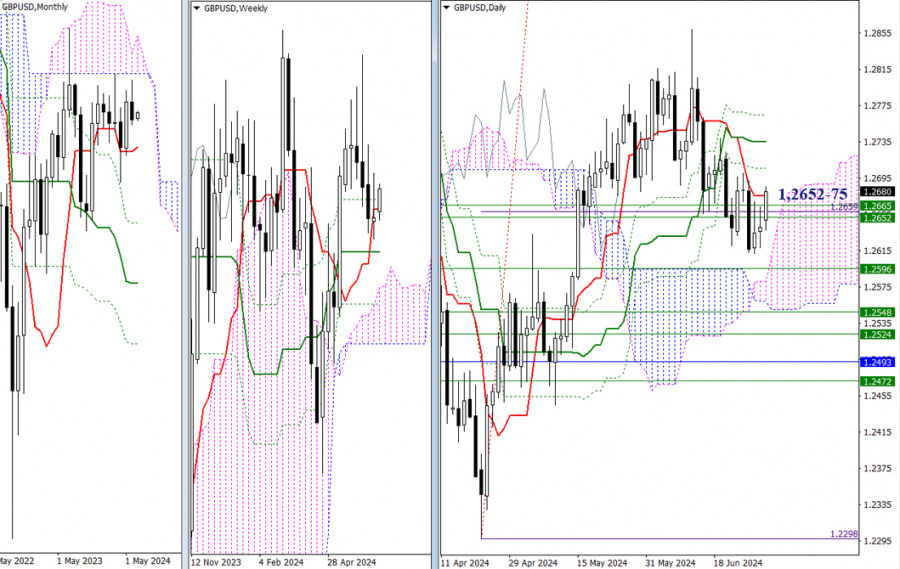
GBP/USD ended the previous month in the area of uncertainty and consolidation. The weekly and daily time frames are forming and confirming the monthly sentiment. Currently, there is interaction with the weekly levels (1.2652-65) and the daily short-term trend (1.2675). The outcome will determine the further development of events. If the bulls prevail, the market will initially focus on overcoming the resistances of the daily Ichimoku dead cross (1.2706 – 1.2736 – 1.2765). However, if the bearish bias proves stronger and the pair returns below the weekly levels (1.2652-65), then the area of 1.2608 – 1.2596 (upper boundary of the daily cloud + weekly mid-term trend) will become significant.

This image is no longer relevant

H4 – H1

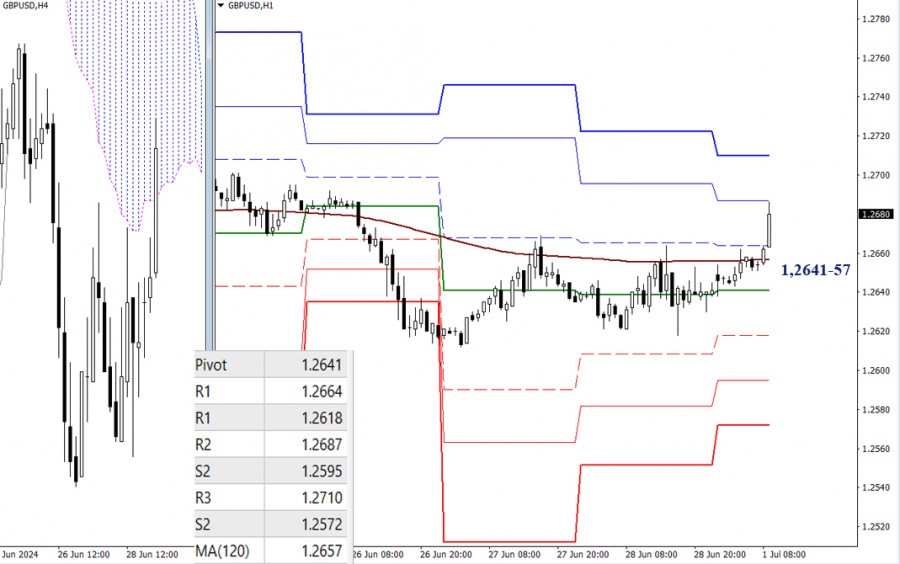
On the lower time frames, the bulls have taken control of the weekly long-term trend and are developing an upward movement. The second resistance of the classical Pivot levels (1.2687) is currently being tested. The next upward target will be R3 (1.2710) and the resistances of the higher time frames. To change the current balance of power, the market must return to the key levels, which are located at 1.2657 (weekly long-term trend) – 1.2641 (central Pivot level of the day), and firmly consolidate below them.

***

The technical analysis of the situation uses:

Higher timeframes - Ichimoku Kinko Hyo (9.26.52) + Fibonacci Kijun levels

Lower timeframes - H1 - Pivot Points (classic) + Moving Average 120 (weekly long-term trend)

รับผลกำไรจากการเปลี่ยนแปลงอัตราสกุลเงินดิจิทัลกับ InstaForex.
ดาวน์โหลด MetaTrader 4 และเปิดการซื้อขายครั้งแรกของคุณ.
  • Grand Choice
    Contest by
    InstaForex
    InstaForex always strives to help you
    fulfill your biggest dreams.
    เข้าร่วมการแข่งขัน
  • Chancy Deposit
    ฝากเงินในบัญชีของคุณใน $3,000 และรับ $4000 ไปเพิ่ม!
    ใน กรกฎาคม ทางเราได้ออก$4000 ภายในแคมเปญ Chancy Deposit !
    คว้าโอกาสที่จะชนะด้วยการฝากเงิน $3,000 ไปในบัญชีเทรด เมื่อทำตามเงื่อนไขนี้แล้ว คุณก็จะกลายเป็นผู้เข้าร่วมแคมเปญ
    เข้าร่วมการแข่งขัน
  • เทรดให้ดีแล้วคว้ารางวัล
    เติมเงินในบัญชีของคุณอย่างน้อย $500 สมัครเข้าร่วมการแข่งขัน และลุ้นรับรางวัลอุปกรณ์ติดต่อสื่อสารแบบพกพา
    เข้าร่วมการแข่งขัน
  • โบนัส 100%
    โอกาสพิเศษของคุณในการรับโบนัส 100% จากเงินฝากของคุณ
    รับโบนัส
  • โบนัส 55%
    สมัครรับโบนัส 55% สำหรับการฝากทุกครั้ง
    รับโบนัส
  • โบนัส 30%
    รับโบนัส 30% ทุกครั้งที่คุณเติมเงินในบัญชีของคุณ
    รับโบนัส


บทความแนะนำ

หากไม่สะดวกคุยในตอนนี้
ระบุคำถามไว้ได้ใน แชท.
Widget callback