Dolzarb patternlar
Паттерны – это графические модели, которые "рисует" цена на графике. Один из постулатов технического анализа говорит нам о том, что история (движение цены) всегда повторяется. Это значит, что в похожих ситуациях движение цены, зачастую, будет похожим, что позволяет с высокой долей вероятности спрогнозировать дальнейшее развитие ситуации.
Актуальные паттерны
- Все
- Вымпел
- Голова и плечи
- Двойная вершина
- Прямоугольник
- Треугольник
- Тройная вершина
- Флаг
- Все
- #AAPL
- #AMZN
- #Bitcoin
- #EBAY
- #FB
- #GOOG
- #INTC
- #KO
- #MA
- #MCD
- #MSFT
- #NTDOY
- #PEP
- #TSLA
- #TWTR
- AUDCAD
- AUDCHF
- AUDJPY
- AUDUSD
- EURCAD
- EURCHF
- EURGBP
- EURJPY
- EURNZD
- EURRUB
- EURUSD
- GBPAUD
- GBPCHF
- GBPJPY
- GBPUSD
- GOLD
- NZDCAD
- NZDCHF
- NZDJPY
- NZDUSD
- SILVER
- USDCAD
- USDCHF
- USDJPY
- USDRUB
- Все
- M5
- M15
- M30
- H1
- D1
- Все
- Покупка
- Продажа
- Все
- 1
- 2
- 3
- 4
- 5
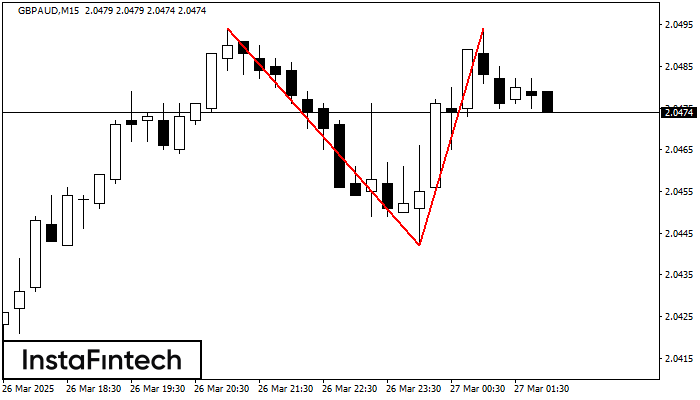
The Double Top pattern has been formed on GBPAUD M15. It signals that the trend has been changed from upwards to downwards. Probably, if the base of the pattern 2.0442
The M5 and M15 time frames may have more false entry points.
Открыть график инструмента в новом окне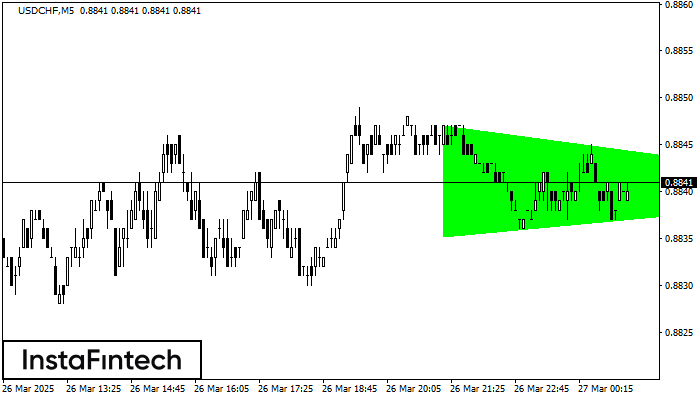
According to the chart of M5, USDCHF formed the Bullish Symmetrical Triangle pattern. Description: This is the pattern of a trend continuation. 0.8847 and 0.8835 are the coordinates
The M5 and M15 time frames may have more false entry points.
Открыть график инструмента в новом окне
The Double Bottom pattern has been formed on NZDCAD M30; the upper boundary is 0.8209; the lower boundary is 0.8165. The width of the pattern is 43 points. In case
Открыть график инструмента в новом окне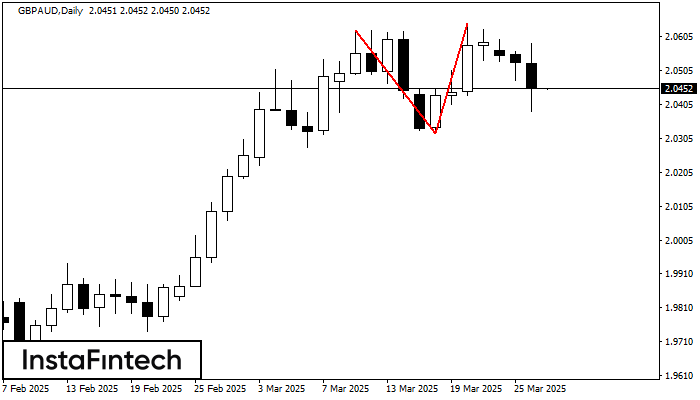
On the chart of GBPAUD D1 the Double Top reversal pattern has been formed. Characteristics: the upper boundary 2.0644; the lower boundary 2.0321; the width of the pattern 323 points
Открыть график инструмента в новом окне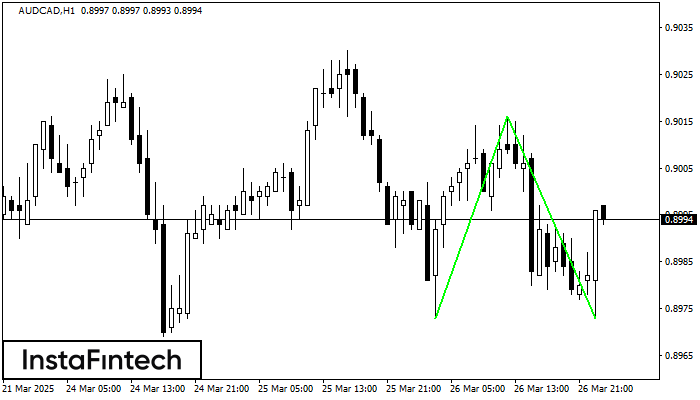
The Double Bottom pattern has been formed on AUDCAD H1; the upper boundary is 0.9016; the lower boundary is 0.8973. The width of the pattern is 43 points. In case
Открыть график инструмента в новом окне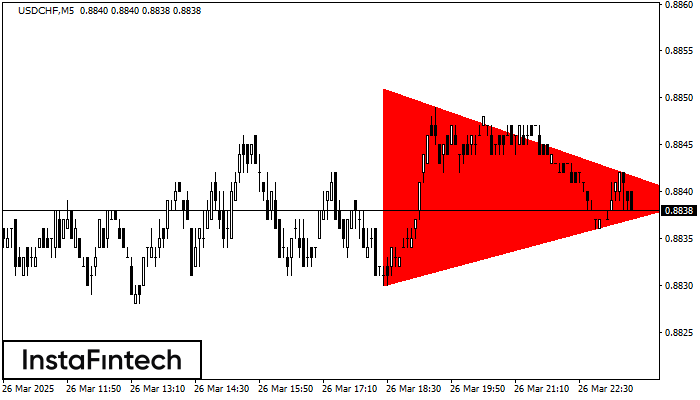
According to the chart of M5, USDCHF formed the Bearish Symmetrical Triangle pattern. This pattern signals a further downward trend in case the lower border 0.8830 is breached. Here
The M5 and M15 time frames may have more false entry points.
Открыть график инструмента в новом окне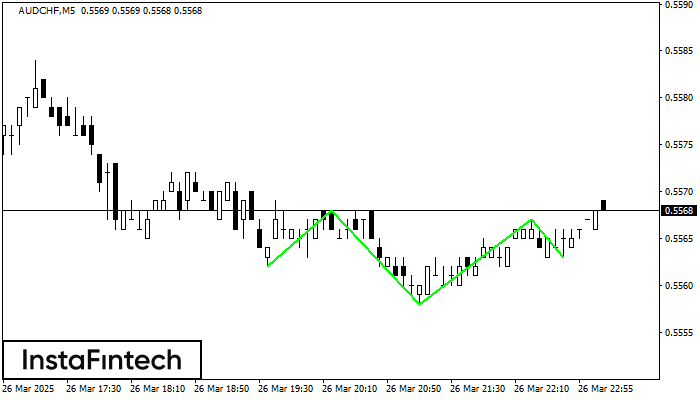
According to M5, AUDCHF is shaping the technical pattern – the Inverse Head and Shoulder. In case the Neckline 0.5568/0.5567 is broken out, the instrument is likely to move toward
The M5 and M15 time frames may have more false entry points.
Открыть график инструмента в новом окне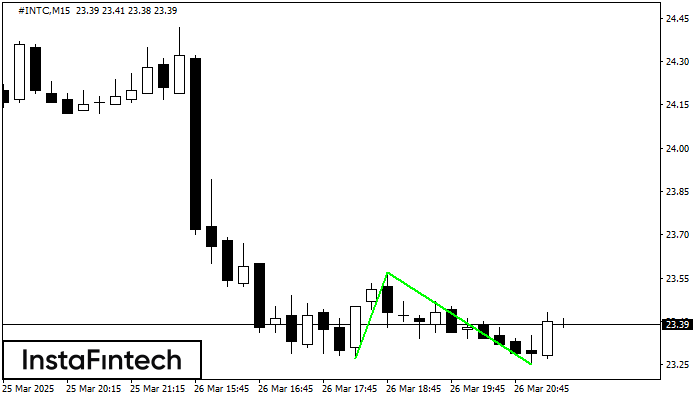
The Double Bottom pattern has been formed on #INTC M15. Characteristics: the support level 23.27; the resistance level 23.57; the width of the pattern 30 points. If the resistance level
The M5 and M15 time frames may have more false entry points.
Открыть график инструмента в новом окне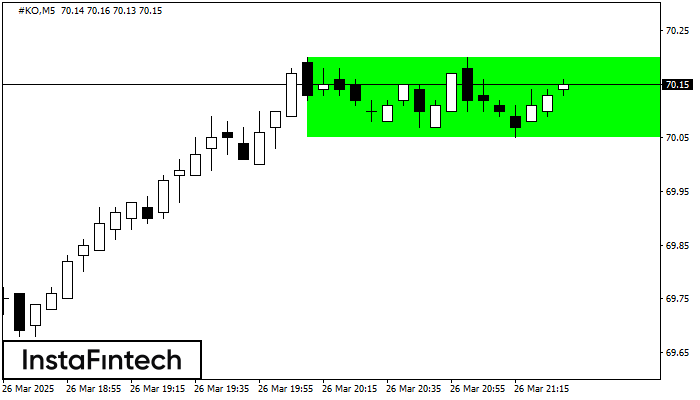
According to the chart of M5, #KO formed the Bullish Rectangle. This type of a pattern indicates a trend continuation. It consists of two levels: resistance 70.20 and support 70.05
The M5 and M15 time frames may have more false entry points.
Открыть график инструмента в новом окне